Case Study
2025
Data Storytelling for Branded Investment Articles
Contributed data visualizations and design for two investment-focused articles published as part of ongoing financial marketing campaigns. Each piece helped translate market insights into digestible, visually engaging content for investors and financial advisors.
Articles:
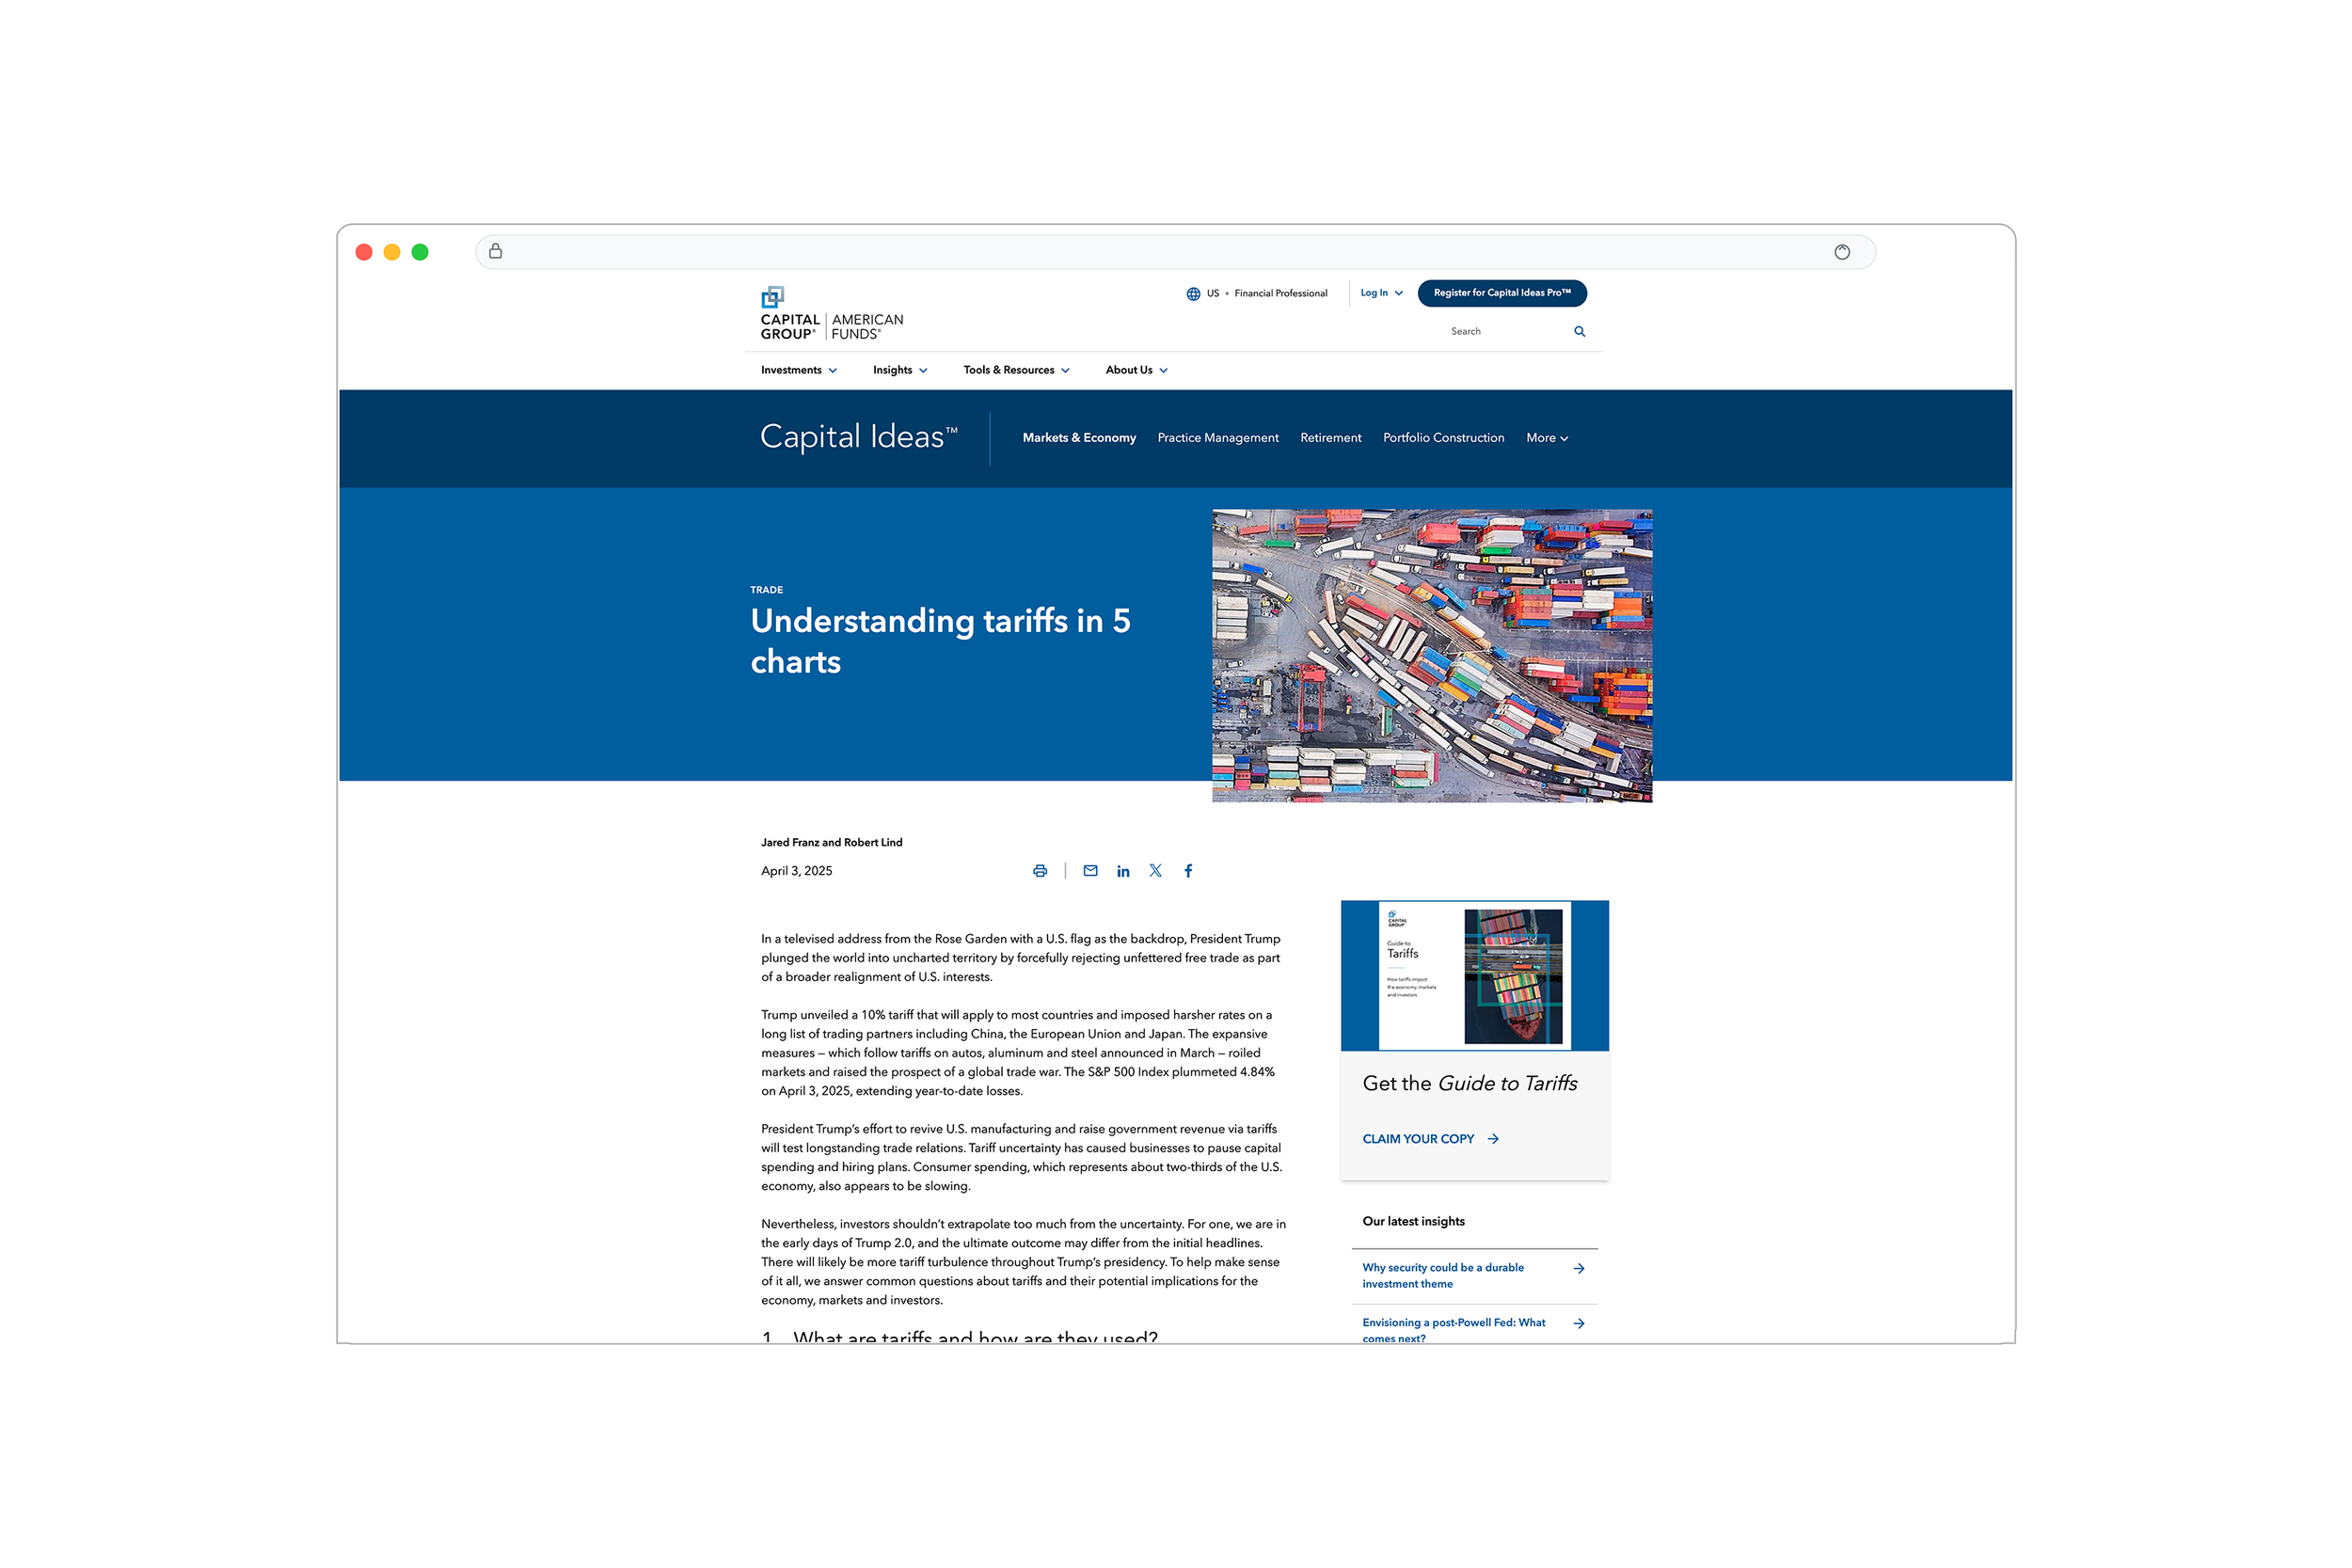
Understanding tariffs in 5 charts
Focus: Portfolio resilience, trade policy
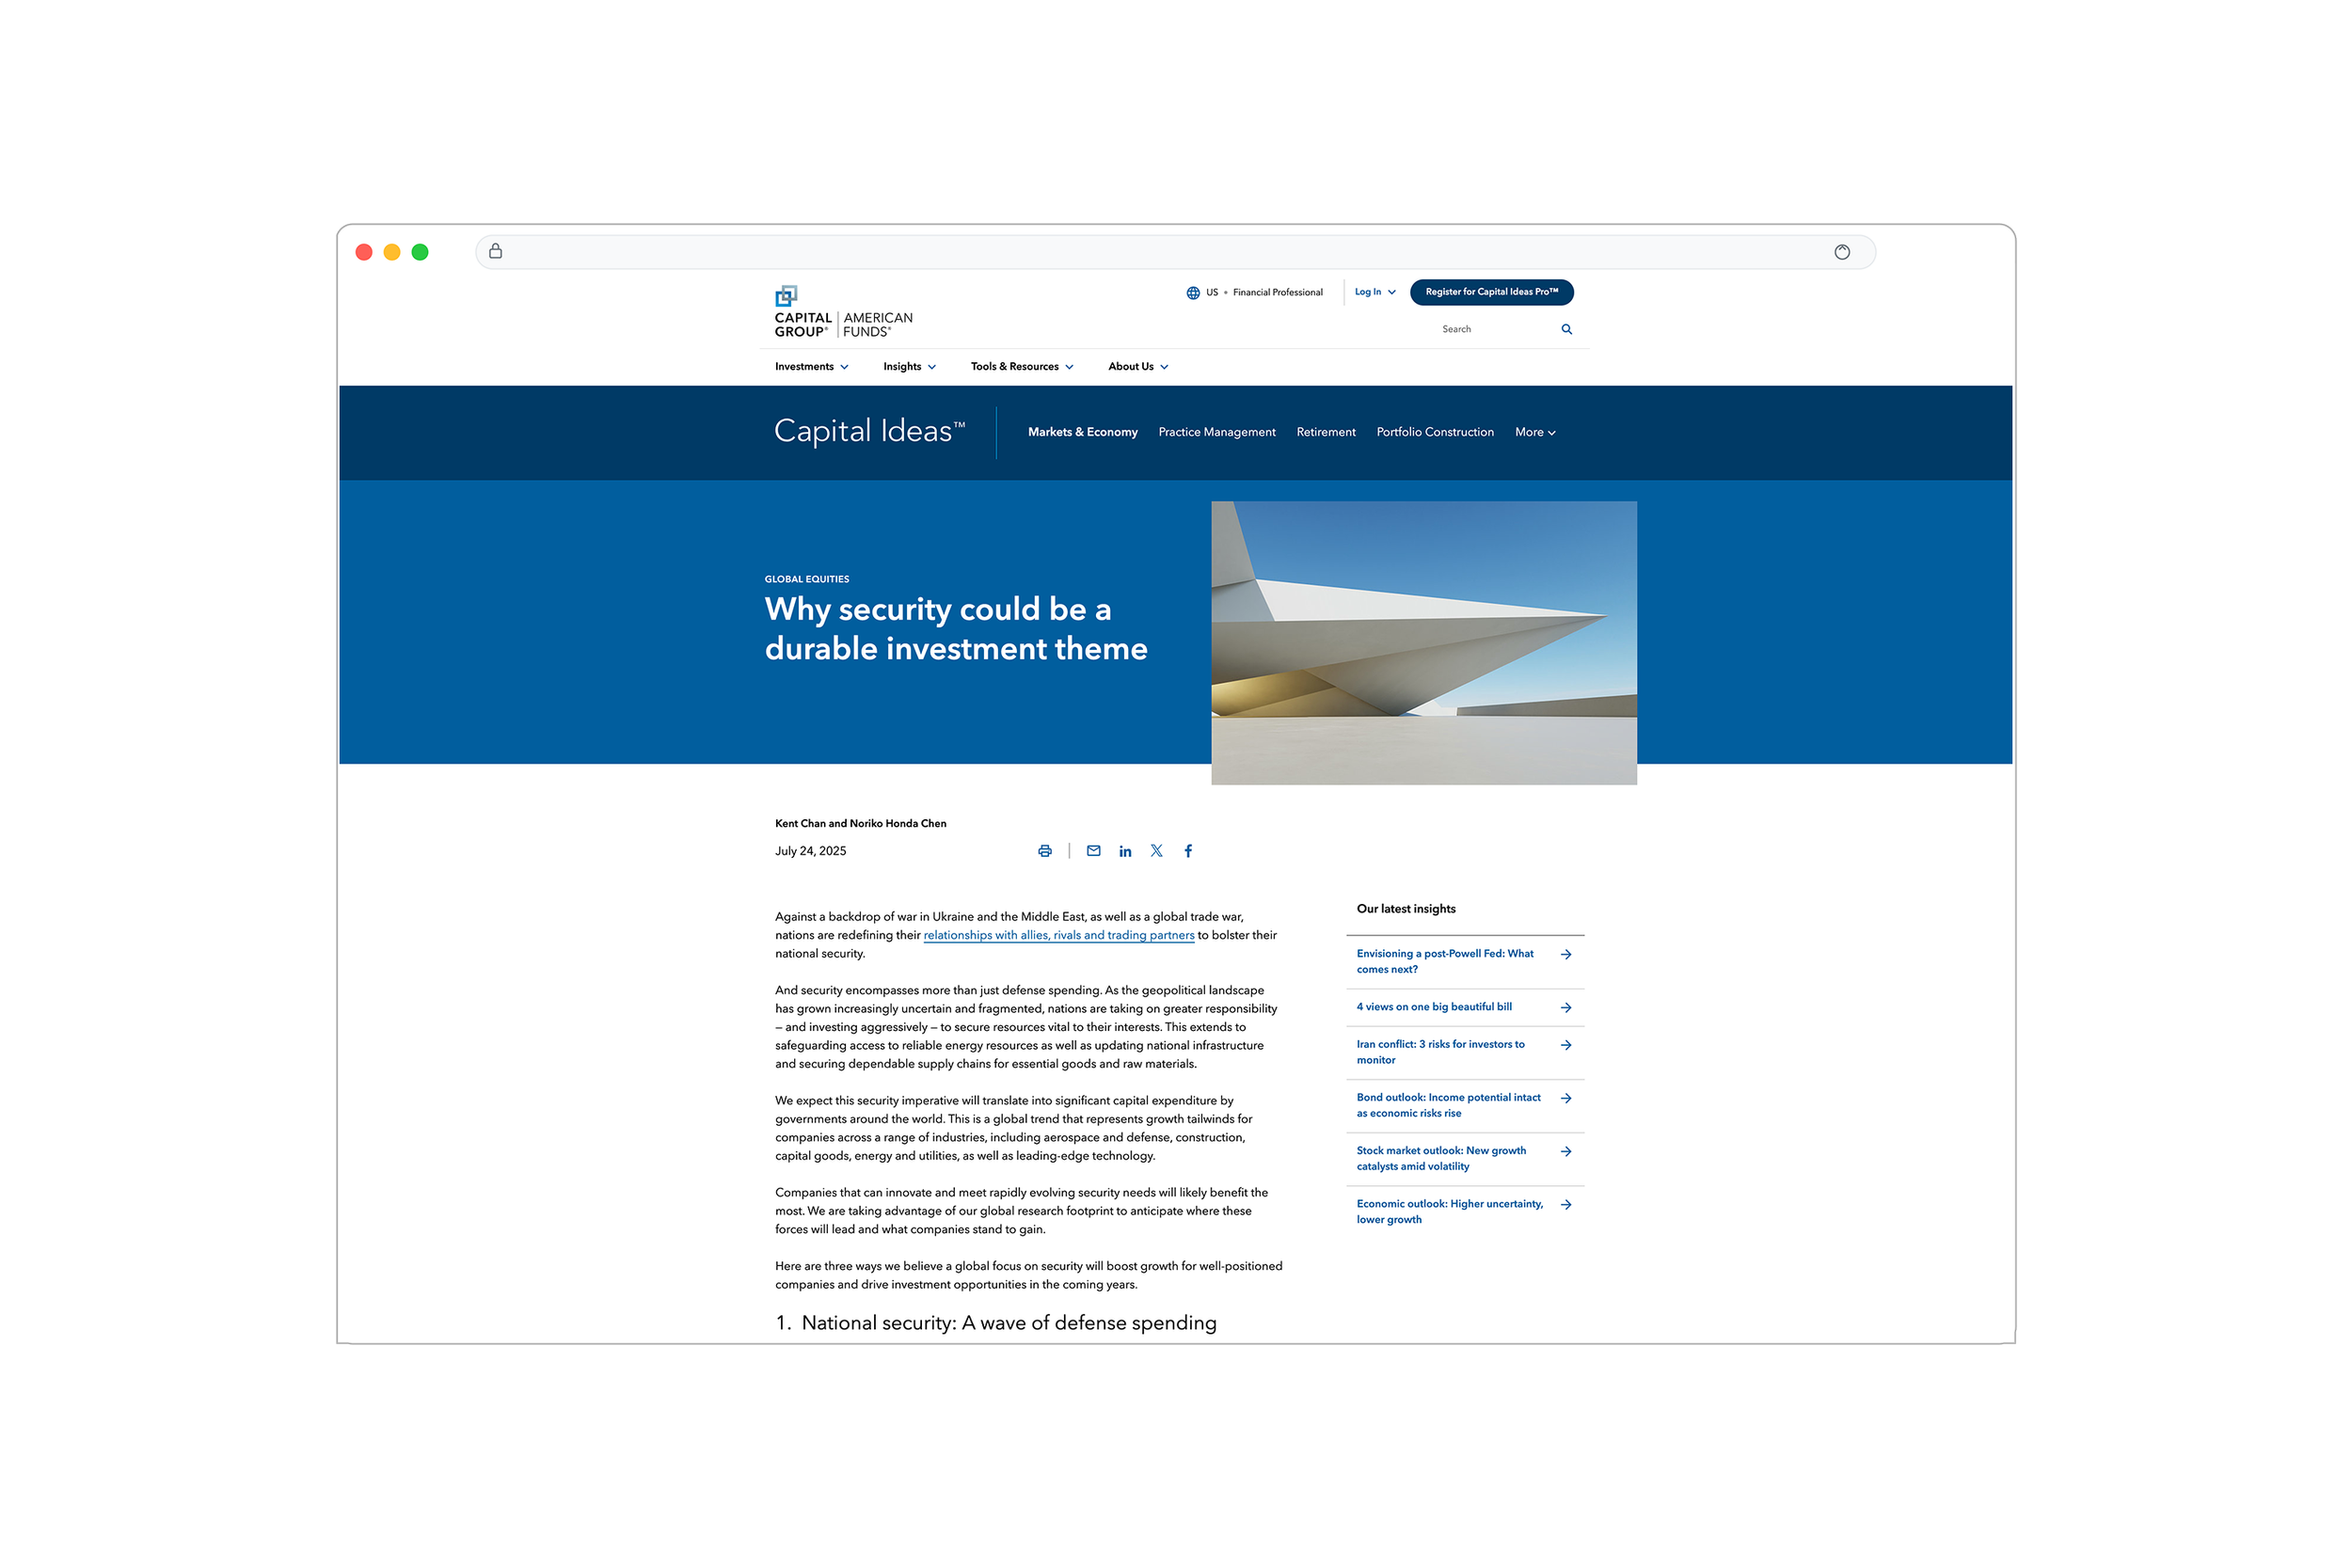
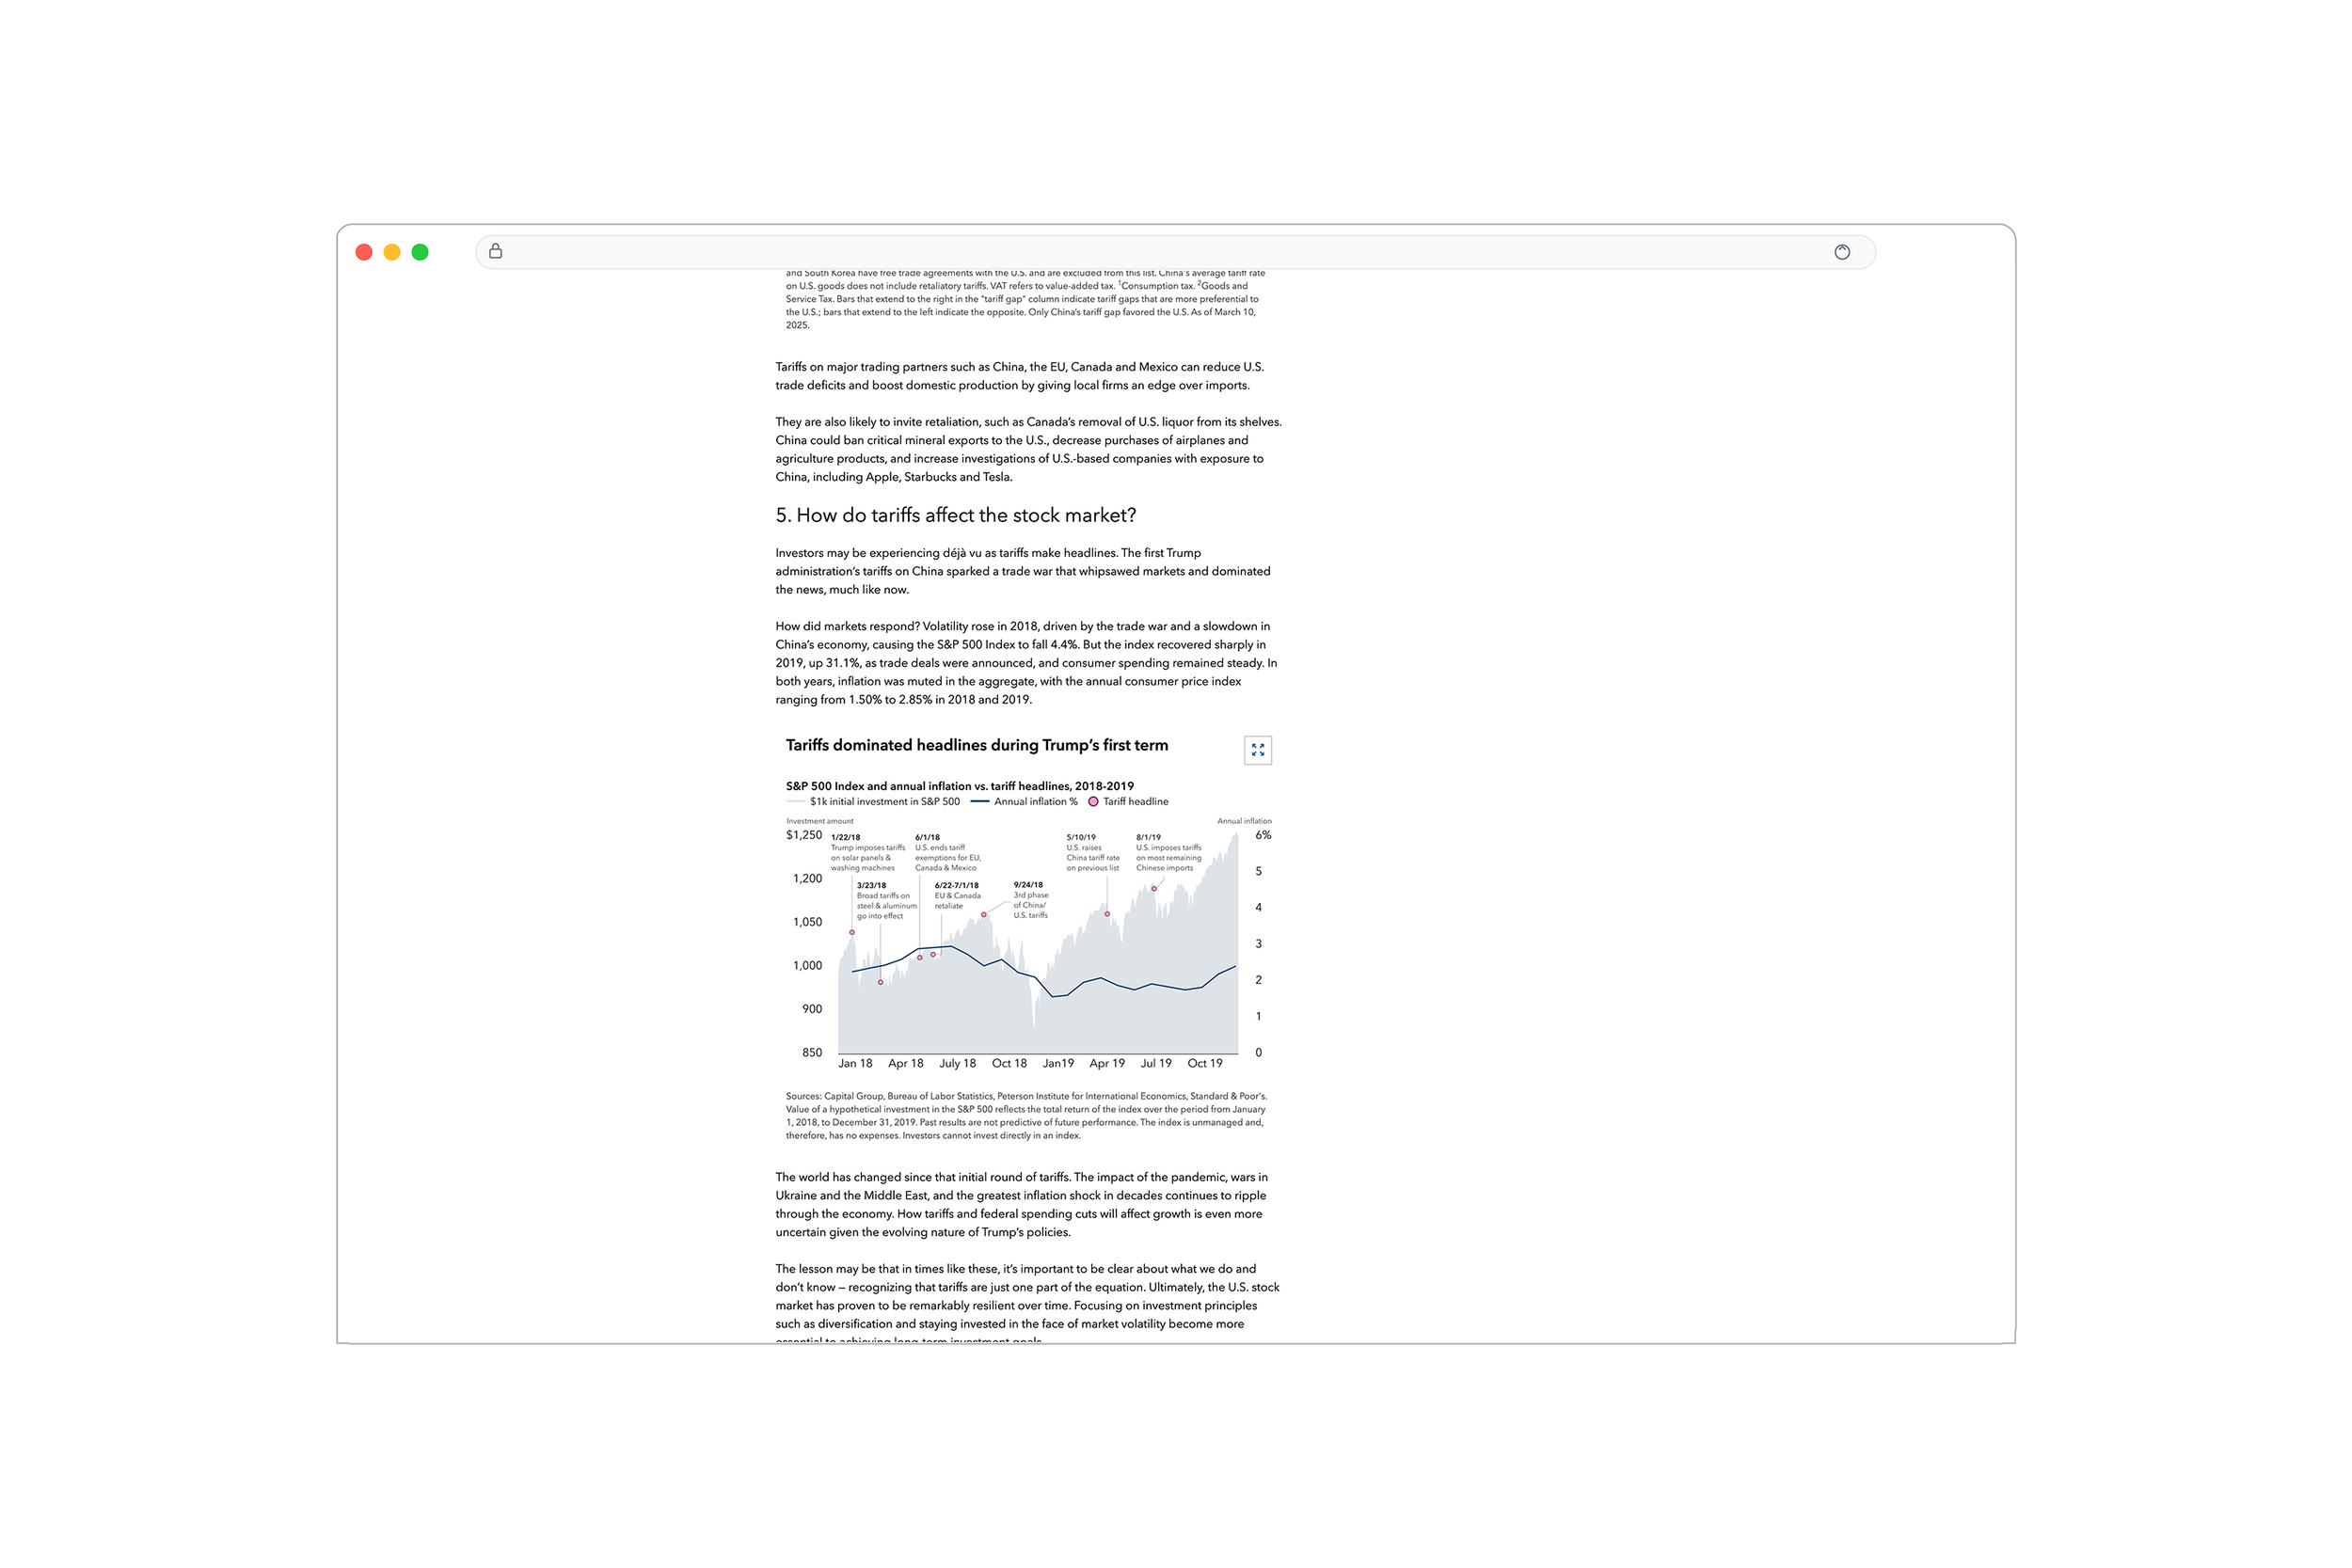
Role: Visualized how tariffs affect the stock marketWhy security could be a durable investment theme
Focus: Global Equities
Role: Visualized how NATO defense spending and energy sources play a role in global markets
Industry
Financial Services
Role
Lead User Experience
Company
Publicis Sapient

Conclusion
Published across email, web, and digital channels, and actively leveraged by advisors and sales teams in client-facing conversations. The Tariffs Hub became a high-traffic content destination during periods of market volatility, offering timely, visually engaging insights that supported both education and engagement.