Case Study
2024
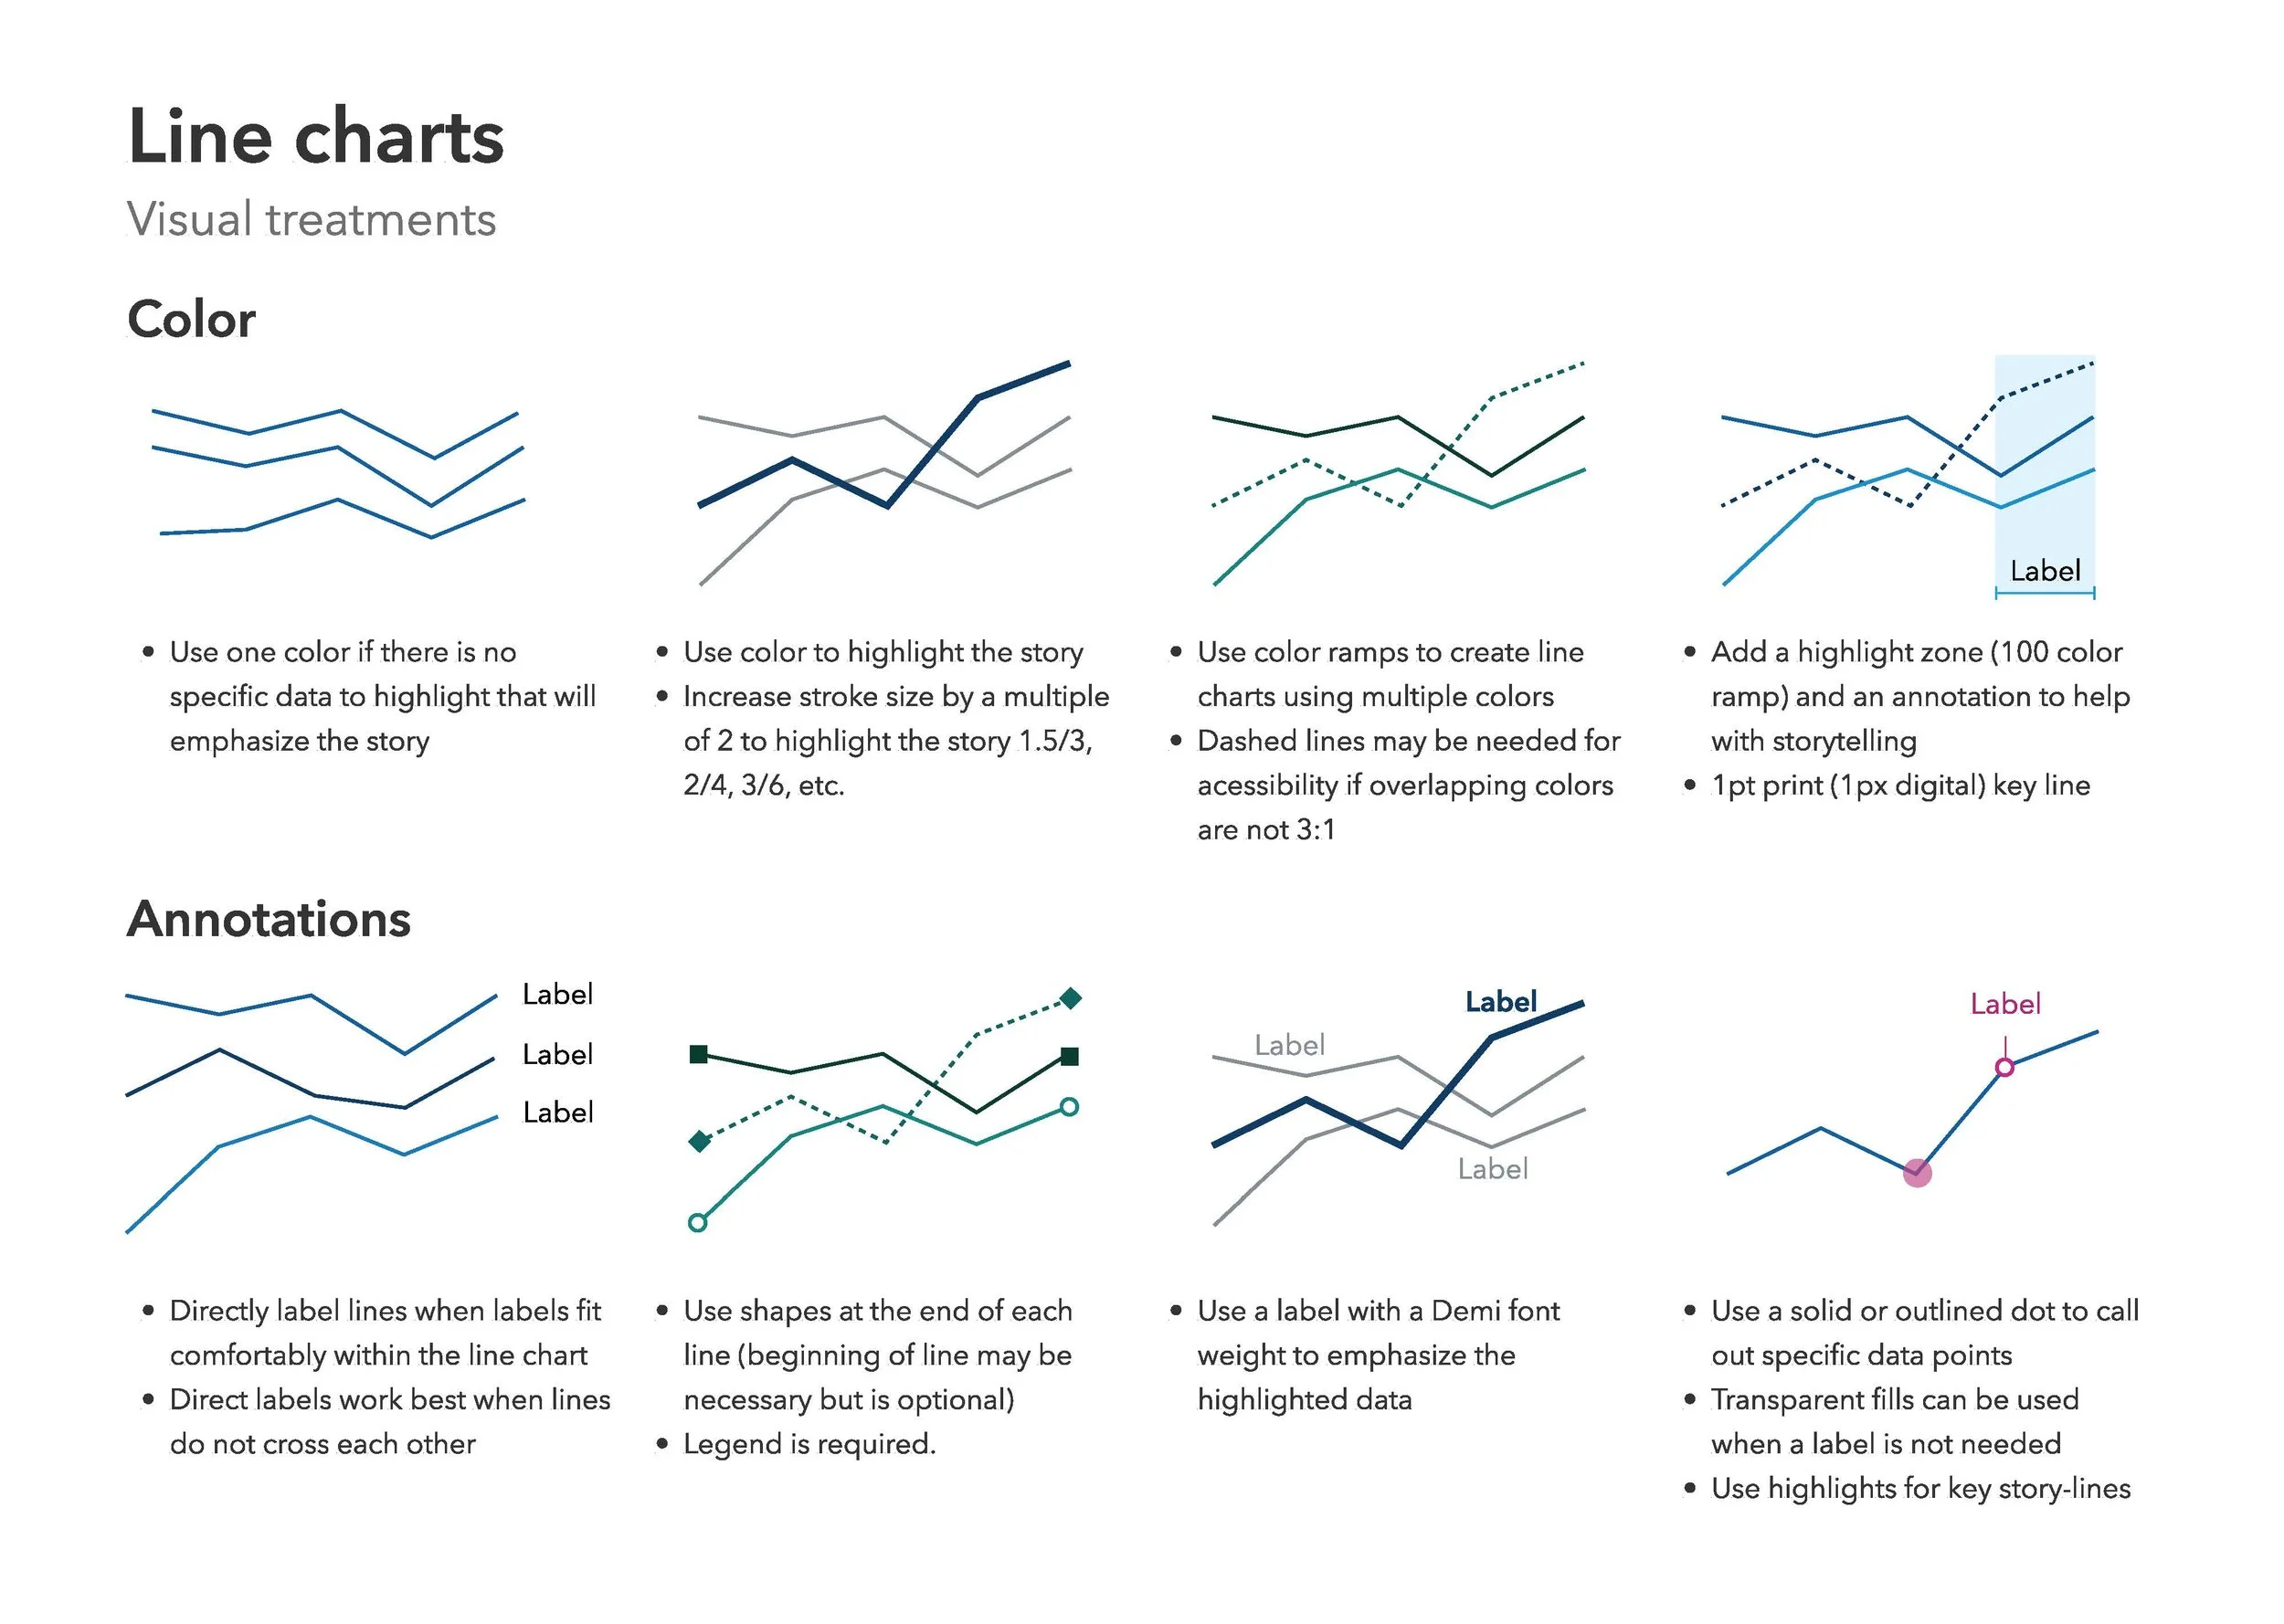
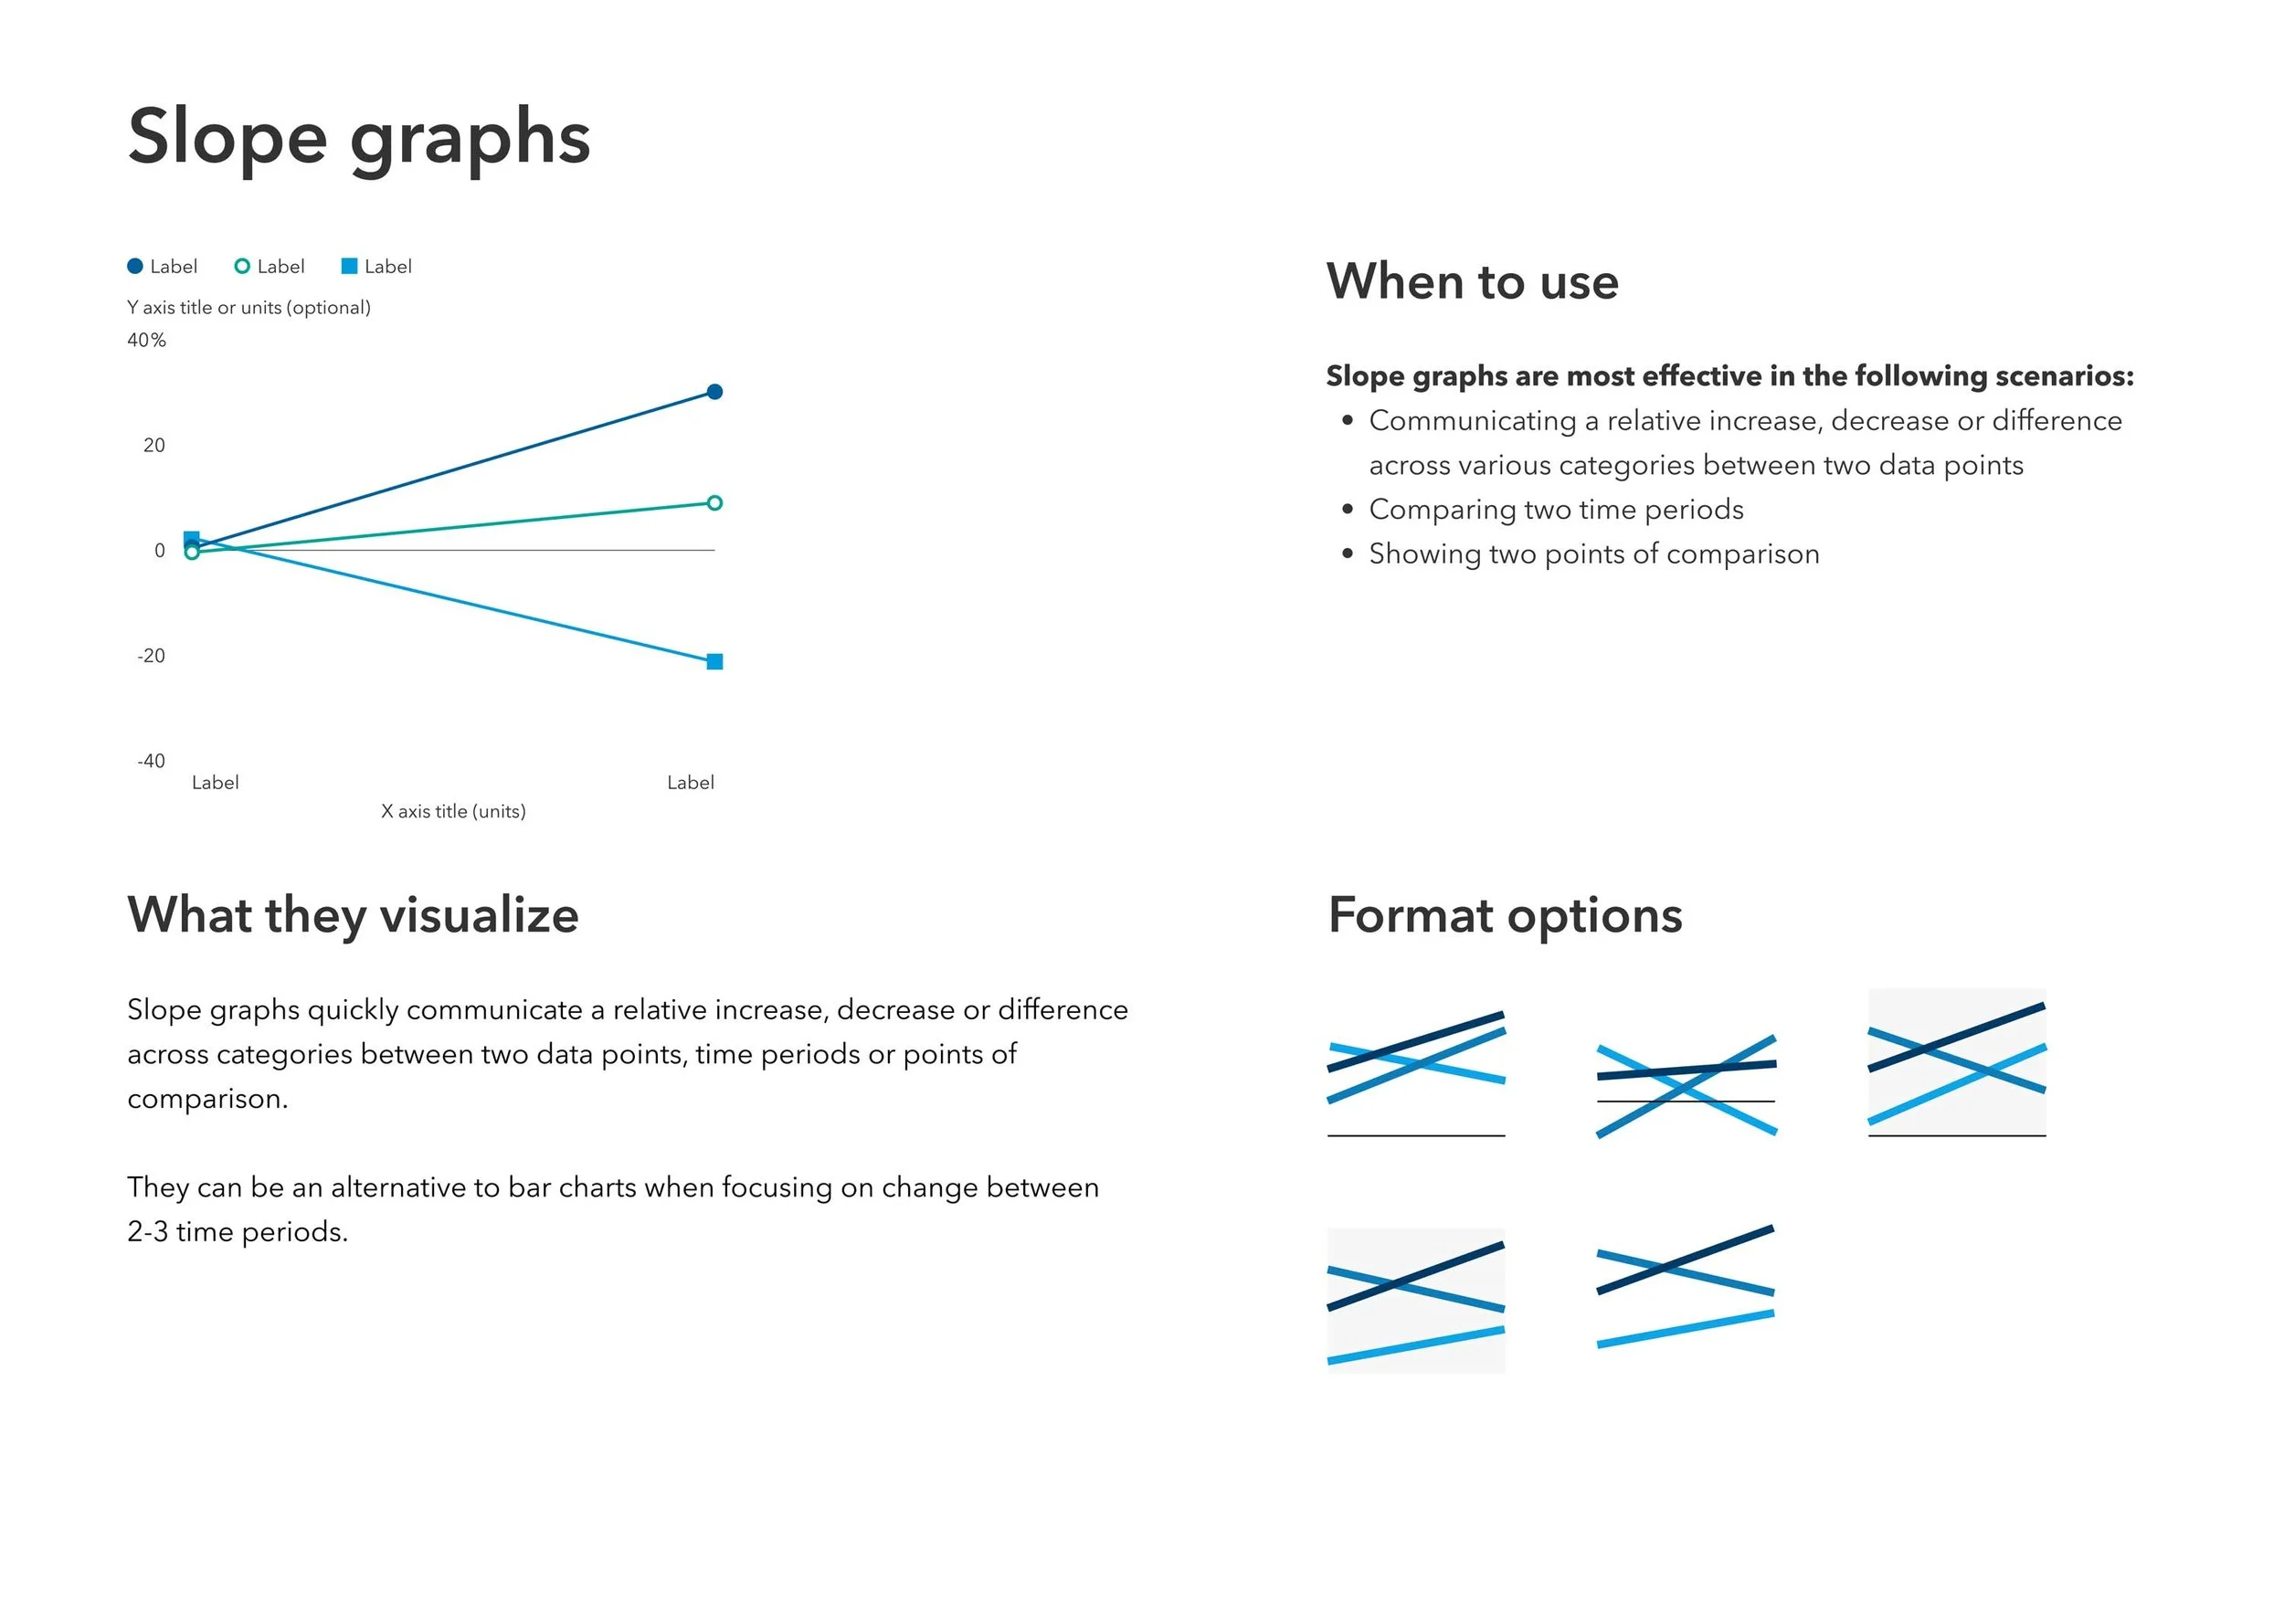
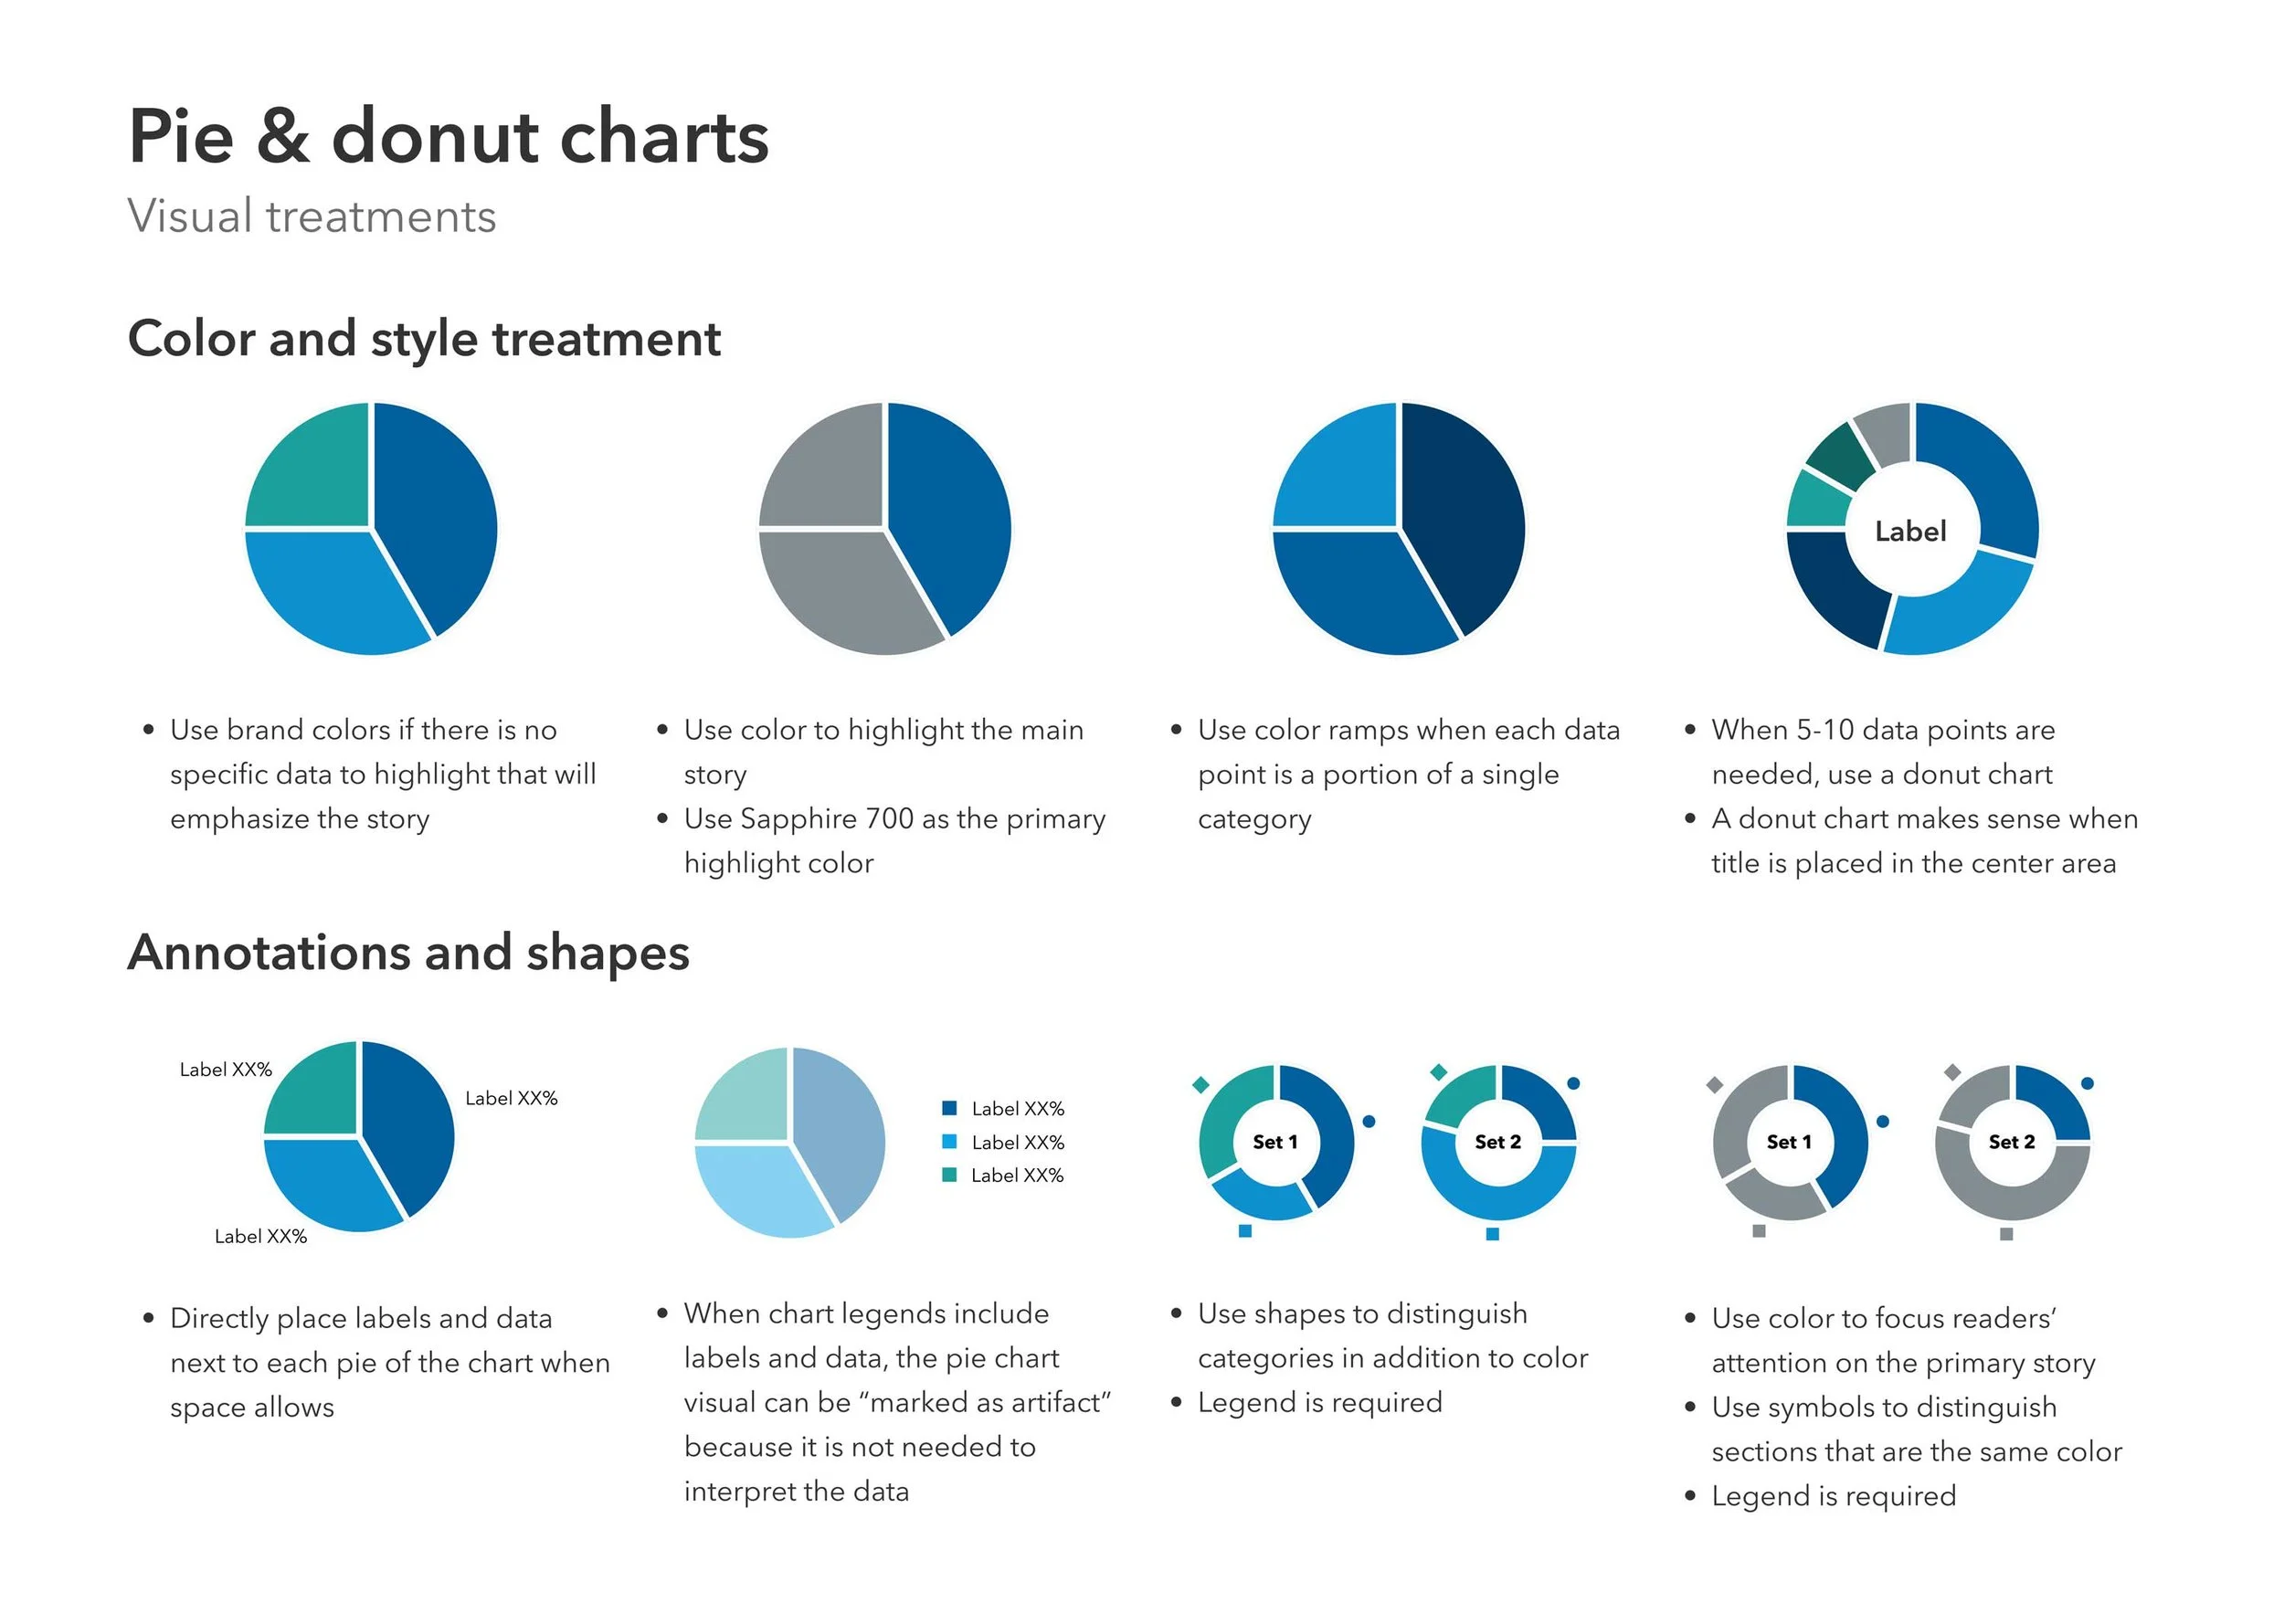
Data Visualization Guidelines
A cross-functional working group identified the need to standardize data visualization across our design organization. With more than 50 designers creating financial visualizations independently, inconsistent approaches were confusing clients and slowing development. As an experienced data visualization designer, I was invited to contribute my expertise to establish comprehensive guidelines now used across all products.
Industry
Financial Services
Role
Lead User Experience
Company
Publicis Sapient

Challenge
Inconsistent Visual Language: Each product team had developed their own approach to data visualization, creating a fragmented experience for clients who used multiple tools.
Repeated Problem-Solving: Designers were spending hours solving visualization challenges that had already been addressed in other products.
Accessibility Gaps: Without standards, accessibility implementations varied widely, creating compliance risks.
Process
01
Discovery
Contributed expertise to audit existing visualizations across the different design groups, identifying patterns and inconsistencies.
02
Knowledge Sharing
Shared 6+ years of financial visualization experience, providing real-world context for what works in advisor-client presentations.
03
Collaborative Creation
Participated in weekly working sessions, offering guidance on complex visualization scenarios and edge cases.
04
Document Review
Provided expert review of guidelines, ensuring clarity and completeness for designers at all levels.
Conclusion
The Data Visualization Guidelines project successfully transformed how our organization approaches data design. By contributing specialized expertise to this collaborative effort, I helped establish standards that reduce development time, improve consistency, and ensure every data story we tell is clear and accessible. The guidelines have become an essential part of our design process.